Problem to Solve – We have a really high speed network, yet we still get users complaining about slow file transfers and slow storage performance. What triage process can I use to determine the probable cause?
GUEST BLOGGER – Mark Fink, Network Engineer with 20+ years experience
 Few problems we face in IT can be as difficult as when someone is copying a large file, or even just a large amount of data, to another host or server and they are not getting the throughput they expect. Sometimes the throughput is up and down and inconsistent. When this happens, it’s very easy to blame the network. Windows Explorer is showing 30MB/s (or 240Mb/s); why I am not getting the full Gig rate? It must be the network – it’s slow!
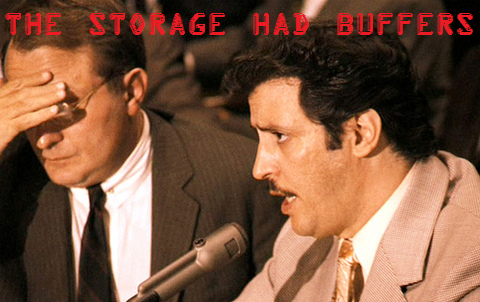
I think of the mobster in “The Godfather” testifying before Congress: “Oh yeah, a buffer. The family had a lot of buffers!”
And the problem is exactly the sort of thing that highlights the need to troubleshoot up the OSI stack. In considering each host, the NICs have buffers, TCP has send/receive buffers, SMB and NFS both have send/receive buffers. And then you have the operating system and storage subsystem with buffers right down to the physical hard drives.
In any case, the problem could be at any of those layers. And to further complicate the situation, optimal throughput could require adjustments at more than one layer. How can you determine what adjustments need to be made with at least some precision, without guessing?
One approach is to simply set the buffer values at all levels to high numbers, without worrying about precision or even if the adjustments are necessary. Seems pragmatic, and it may very well yield good results particularly if both hosts are on the same LAN. However, there are risks. For instance, you can set TCP buffer values too large, so that performance is degraded because of it, particularly when pushing data across relatively high latency segments like a WAN. And there are many articles written about this.
Also, while you can control the buffer sizes for TCP and SMB and NFS, drivers don’t always allow tuning the NIC or the storage subsystem, and the problem may well be there. You can waste a lot of time arbitrarily tuning things and see no difference. I’ve been there! And as engineers, we want to know what the issue is, not just keep guessing at it.
The “Go-to” Measurements
A good, top-to-bottom (or better stated, bottom-to-top) triage is needed! And packet analysis is indispensable here. I have a small set of go-to measurements I look at for this effort.
Starting at the bottom: look for frame errors like FCS and CRC errors between the hosts and switch(es). We can’t rule out a flaky NIC, cable, or switch port. And you can see this many ways without a packet trace: host CLI commands or switch commands (assuming you’re using an intelligent switch). However, the packets will also show it, and since we will be looking to the packets in subsequent steps, it makes sense to implement a monitoring system that is based on packets.
Next level: retransmissions and duplicate ACKs – signs of packet loss, a “network” issue, or at any rate a lower-level stack issue that could still be with the NIC and drivers on each host potentially. In any case, if I see issues here, I’m not troubling myself with TCP or SMB or the storage subsystem.
Working our way up to TCP: the TCP Zero Window – my favorite go-to metric when isolating storage issues (yes, I’m a nerd!). It’s my favorite because it’s easy to see and immediately points to a higher-level stack issue and absolves the network. However, it is still far from root cause. All we can say is that something is wrong somewhere from the TCP level on up, possibly into the storage subsystem. For instance, a degraded RAID array will trigger TCP Zero Windows; in fact, I worked one case where that was precisely the issue.
Next: SMB or NFS errors, specifically relating to buffer overruns – all visible in the packet flow and quickly identifiable with the right software. In fact, these can lead to zero windows and when we resolve buffer overruns at this layer, often the zero windows go away with it. In another case, we had to adjust buffers at both layers. And I can’t imagine figuring that out without good software to show me what was happening at those layers.
That’s as far as we can get with packet analysis. Beyond that, you should be looking at the operating system storage drivers and the storage subsystem itself. For instance, if the storage subsystem simply isn’t fast enough to keep up with the bit rate you’re throwing at it, that’s a whole different matter. And there are hardware benchmark tests available to quickly see this condition.
Coincidentally, storage subsystem issues or slowness typically manifest with zero windows on the network, at least in NAS scenarios where you are accessing storage across the network. Which leads to continuous monitoring of zero windows, particularly in a NAS context, with intelligent alarms when they violate statistical deviations or hard thresholds. Did I say the zero window is my favorite metric when monitoring storage?
What Do You Think??
- What processes have you employed to troubleshoot storage or file transfer issues?
- What “Go-to” metrics have you used and why?